This blog post offers some helpful tips for those interested in submitting a creation to the contest. There will be three winners of the contest and winners will receive a free trip to Guadalajara, Mexico for the OECD 5th World Forum.

We are in the home stretch of our data viz competition! Don't panic! If you haven't started your submission yet, you still have plenty of time to do so. Even if you have never done data viz before, we strongly encourage you to apply! Don't let the "data" part intimidate you; all you need is a good imagination and strong communication skills!
The main goal of this contest is for you to use numbers to tell a story about well-being in the world today. By well-being we mean anything that is important for people to have a happy, fulfilled and productive life. Well-being is a broad and subjective topic, so we don't expect you to cover everything.
We suggest picking one or more themes to focus on, as long as they relate to people's current or future well-being.
- Examples of these include: education, happiness, health, peace, poverty, work, environment, or freedom.
- The choice of topics is up to you, as long as you can find reliable statistics to help you tell your story!
- Pick a country or state. Look for different statistics that give a broad picture of people's lives and well-being. See example:
 |
| Copyright: Landesa |
- Pick a theme (such as poverty or health) and select statistics that help to give insight into that topic in a country, or across a group of countries. See, for example, the OECD Better Life Index or the UN Sustainable Development Goals for some inspiration of key topics related to well-being and sustainability.
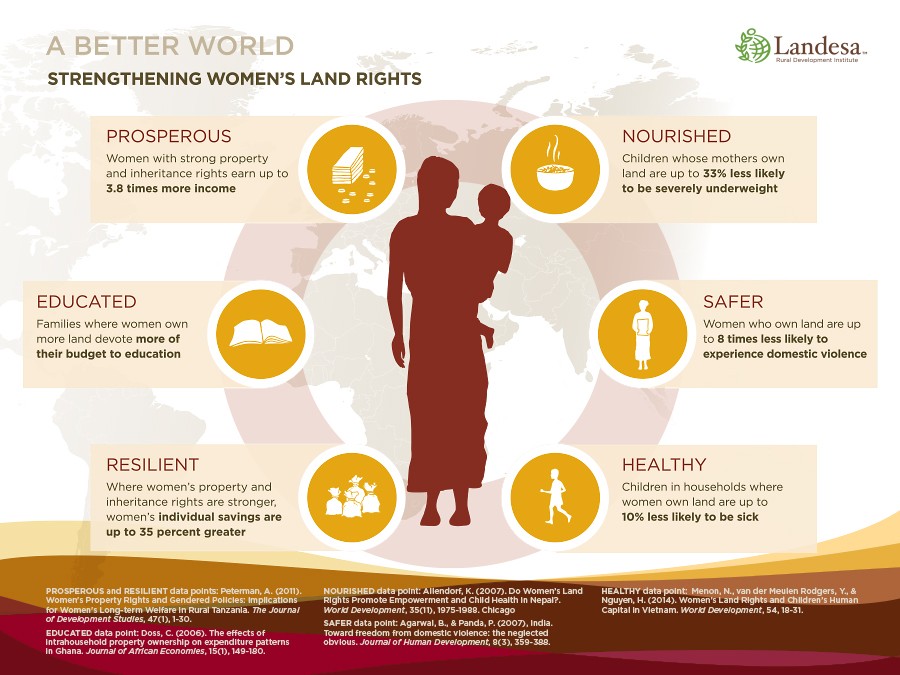
- Pick a group to focus on (like children or the elderly) and find statistics that can help you to tell a story about well-being within that group or between different groups (e.g. by gender) Example:
 |
| Copyright: Landesa |
- Look for inspiring or interesting statistics on the websites of projects that produce indicators (or indices) of well-being. Examples include: The Global Peace Index, The Global AgeWatch Index, Multidimensional Poverty Index Data 2015, and Environmental Performance Index. Many more can be found on Wikiprogress.